
What is the UK’s climate change and environmental policy?
We look at the laws on climate and environment that all UK governments have to stick to, before exploring the pledges and actions across different policy areas.
The UK assesses its carbon emissions in three different ways – and only one of these figures is sent to the United Nations, who monitor how countries are progressing towards the world’s globally agreed climate commitments.
If you find this ‘What are the UK’s carbon emissions?’ explainer useful, please share it using the social media buttons above, or copy and paste this link: URL
Tell Labour they can win votes by prioritising climate action – Pledge to put climate first at the next election. Make the pledge and we’ll tell you when and how to cast the strongest tactical vote for climate in national and local elections.
Countries report their emissions to the United Nations (UN), which oversees the world’s progress towards the Paris Agreement – the global treaty which aims to limit temperature rises to 2C (or ideally 1.5C) above pre-industrial levels.
The UK measures its emissions in three ways, and only one of these figures – territorial emissions – is reported to the UN. Territorial emissions were at 371 million tonnes of carbon dioxide (CO2) equivalent in 2024. This is a 54% reduction in emissions since 1990. The UK’s territorial emissions represent around 1% of the total global emissions produced by all countries.
Territorial emissions include emissions produced and absorbed by:
The UK also measures ‘residence’ or ‘production’ emissions, which looks at emissions from economic sectors and which includes emissions from companies based in the UK but operating elsewhere in the world. For example, this method would count emissions produced by a UK-owned shipping company operating overseas. These emissions have fallen by 43% since 1990 (as of 2024).
Finally, the UK counts its consumption footprint – the emissions produced by all goods and services consumed in the UK. For example, this would count emissions from a car manufactured overseas but bought and used by someone in the UK (known as ‘embedded’ or ‘embodied’ emissions). Footprint emissions are much higher at 740 million tonnes of CO2 (2022). Overall, they have fallen, but by less than the other two categories – 20% since 1990. Embedded emissions specifically have increased since 1990.
This chart shows the UK’s consumption footprint, 1996-2022:
No, for a few reasons.
Territorial emissions exclude international aviation and shipping produced by UK companies. Under UN rules, no single country is formally responsible for reporting these emissions, despite the fact that they account for 5% (and rising) of global CO2 emissions. For example, this means the emissions from a British Airways flight taking off in London and landing in New York would not be fully counted, even though BA is a UK-registered company.
As the UK has de-industrialised, many goods have stopped being manufactured domestically, with production moving to other countries. When these goods were made in the UK, the emissions generated in the manufacturing process would have been counted under territorial emissions. Now they are produced overseas, they are not – even though the products are still produced (generating emissions) and used in the UK. Although emissions are counted by the manufacturing country, it could be argued that this approach gives an inaccurate impression of the amount the UK has cut its emissions by.
Although the UK only produces about 1% of global territorial emissions today, its contribution over time is much larger. Britain kickstarted the industrial revolution – some argue that this makes the UK particularly responsible for climate change, meaning we have a duty to cut our emissions faster. Estimates suggest that the UK was the top emitter from 1750 – the very start of the industrial revolution – until as late as 1889, when it was overtaken by the United States. Overall, the UK has emitted 4.4% of total emissions since 1750. To put this in perspective, today the UK has 0.84% of the global population.
Using territorial emissions, the top emitting sectors of the UK economy are:
This graph shows how emissions for each of these sectors have fallen over the last 35 years according to the territorial method of calculating emissions:
UN scientists have calculated the amount of CO2 the world can emit while keeping temperature rises within 1.5C of pre-industrial levels. This is called our ‘carbon budget’. Each country has a carbon budget in proportion to its size. Here at VoteClimate, we have calculated that under current government policies, the UK will exceed its carbon budget in the mid 2030s. So the UK’s carbon emissions are not falling fast enough.
There are lots of things you can do – from switching to a plant-based diet to giving up flying. There are many good reasons to take individual steps to reduce our emissions. However, what we do as individuals is a drop in the ocean. What we really need is government action.
At VoteClimate, we want to show the Labour government that it can win votes in future elections by adopting better climate policies. You can pledge to put climate first at the next election – if enough people make this pledge, we can show Labour that voters want climate action. And when you sign up, we’ll tell you when and how to cast the strongest tactical vote for climate in national and local elections.
See the latest news & updates from VoteClimate.

We look at the laws on climate and environment that all UK governments have to stick to, before exploring the pledges and actions across different policy areas.

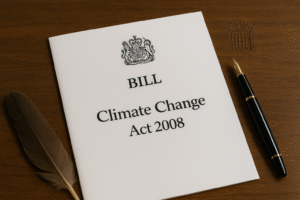
The Climate Change Act 2008 was the world’s first national law to set legally binding emissions reductions targets.